Results of the customer satisfaction survey 2022
Thu Jun 30 11:30:00 2022
Once again this summer, we conducted a customer satisfaction survey to survey our customers' experiences and opinions about Nestor Cables. The results of the survey help us identify problem areas and improve our operations. Versions of the customer satisfaction survey were sent to both our domestic and export customers. In this blog post, we focus specifically on results from our export customers. We thank all those who responded to the survey!
This was the third time we conducted a customer satisfaction survey this way. We conduct a survey every year so that we can monitor the development of customer opinions in the long run and how our actions have affected them. After the summer season of 2022, we will once again also carry out a survey of those customers who have ordered products from us during April-August: with this shorter survey, we want to map our success during the busy summer season.

Customer satisfaction surveys were conducted online and separate surveys were conducted for domestic and export customers. This year’s survey had more respondents than last year. In the survey, respondents were asked to rate our success on a scale of 0-10, with 0 being the worst grade and 10 the best.
In addition to answering the questions, the respondents were also able to comment freely on Nestor Cables and our operations in the survey.
Service
In the export survey, respondents were mainly satisfied with our service, and it received a lot of the highest grades of 8-10. When asked if our contact persons were easily and quickly reachable, respondents gave us grades 9-10.
Our support and instructions received good grades (8-10). When asked if respondents feel that they get the information they need from us, the most popular grade was 10.
In the domestic survey, respondents were mainly satisfied with our service, and it received the highest grades of 8-10. Our support and instructions were also felt to be comprehensive, and our information and available documentation was adequate. They all also received mainly grades of 8-10. The comments praised, for example, instructions for using the products. The comments also mentioned the speed of the service and the salespeople who know their field.
Delivery times
In questions regarding satisfaction with delivery times and their correct content, we received often grade 5 or 8-9 from respondent in the export survey. During the last year there has been some trouble in global logistics chains, which is clearly reflected in the survey. When asked about the right content of the deliveries, the most popular grade was 9.
In the domestic survey our grades for delivery were better, mainly grades 8-10. However, when it came to satisfaction with delivery times, the emphasis was on a grade of 8. A few individual comments also mentioned that some deliveries had been slow and that there was a need for flexibility in delivery times.
The comments highlighted, for example, our good responsiveness in exceptional situations.
Product range
When asked if our product range meets their needs, the most popular grades from the export respondents were 8 and 10, but the answers were varied. The majority of grades were from 5 to 10. When asked about the quality of products, the answers were quite similar. It is clear that while the export respondents are generally happy with the product range, this might be an area where we could improve.
The domestic respondents were satisfied with the product range and gave it grades 8-10. We feel that we have been particularly successful with the quality of the products, as its ratings were mainly grades 9-10.
Marketing
This time, we also asked if our marketing is perceived as interesting (the most popular grade 9) and contains useful information (the most popular grades 5, 9 and 10). We also asked if respondents were following us on any social media channel: LinkedIn proved to be by far the most followed channel.
In the domestic survey, the most popular grade in questions concerning our marketing was 8.
Net Promoter Score
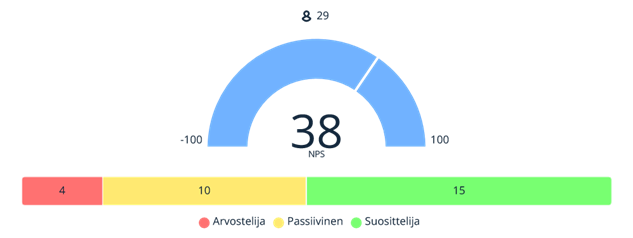
This time we also wanted to test customer loyalty with NPS. The NPS (= Net Promoter Score) is the most widely used measure of customer loyalty internationally. It measures a customer’s willingness to recommend and their satisfaction with a single question: it asks if the respondent would recommend us to others. The customer satisfaction survey revealed that our export NPS number is good.

Based on the domestic survey our NPS number is excellent.
Based on this year’s survey we can see that our operations serve our customers quite well. We can also identify some areas in which we could improve our performance. Overall, the grades we received in the domestic survey were better than the ones we got in the export survey, which might suggest that we should put more effort into our export market to understand their needs and to service them better.
Thank you to everyone who answered the survey!
![[NAME]](https://www.nestorcables.com/media/layout/img/logot-ja-kuvat/nestor-cables-logo-white.png)
